Monthly Archives: July 2020

The Over-Riding Royalty Interest Dilemma

Geologists, landmen, and engineers often work for an over-riding royalty interest (ORRI.) As one geologist recently told me, “If I can ever get rid of this ORRI, I’ll never sign another.” What is an “over-ride”? In lieu of a direct payment, the owner of an ORRI may elect to earn a percentage of the well. This used to mean that you got a half to perhaps one and one-half percent of the gross proceeds, either as oil placed in a tank you set, or more commonly a percentage in dollars of the gas or oil sold. In practical terms is amounted to say 1% of the gross sales based upon the price of the oil at the wellhead.

Deregulation changed all that. Oil and gas isn’t priced “at the wellhead” rather is priced at the end buyer, be it next door or a thousand miles away. The cost of transportation, compression, etc. was then deducted from that price to arrive at the “price” at the well head. Lumped into those “post-production” expenses also were likely to be maintenance of the well by a pumper, water disposal, etc. The end result was a huge amount of that 1% disappeared into the coffers of the well operator. And the ORRI was no longer a real royalty, rather an earned working interest devoid of the initial cost of actually drilling the well and paying for the leases.

This is all well and good so long as the gross sales exceeds the gross expenses. With the collapse of oil prices in 2020, suddenly even these so-called “royalties” are no long making money, rather the ORRI is billed for the expenses. Whoa! Wait a minute. Isn’t that the very definition of “economic limit”? Why are the oil companies still pumping oil if every barrel is being sold at a loss? Why don’t they shut the wells in? Aren’t they obliged to do so as a “prudent” operator?

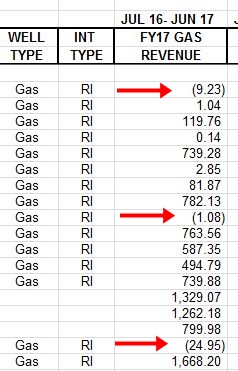
The answer is simply that the operators are trying to cash flow every dime they can to stay afloat. Then they will file bankruptcy if they have to. They are hoping to cover the current bills and wait out the market until prices improve. So the ORRI owner is left owing money for what once was totally expense free. This also means that when post-production expenses exceed the income, the mineral owner is also stuck with the bill! What? How can that happen? Well, it does happen, sometimes buried up in the check stub statement are such negative incomes. Since these may be disguised among payments from several wells, the owners often don’t even notice their income statement has a negative entry.  And this has been happening well before 2020. See the date on the list below.

When Royalty is more a working interest than a royalty

The Life & Death of the Fayetteville Shale

The Fayetteville Shale was the second shale gas play to succeed. The Barnett Shale proved the technology to work. And in doing so, opened a Pandora’s Box of horizontal shale plays dependent upon the slick water frack; or early in the play, nitrogen and carbon dioxide fracks. Some failed while others succeeded spectacularly. The Caney, a shale situated between the Fayetteville and the Barnett geologically, was a dud. But the Haynesville and Fayetteville suddenly added a huge influx of natural gas to the supply. That proved incentives to drill other areas, including the Marcellus Shale and Utica Shale of the Northeast.
The problem then became price as surplus led to lower prices, prices so low that wells were often uneconomic despite producing a lot of gas. But the nail in the coffin for the dry shale basins like the Fayetteville was oil. At first, drillers didn’t believe they could make any oil whatsoever from a shale well. But that proved to be wrong.
The Woodford, Bakken, Haynesville, Niobrara, and other oily shales proved to be able to produce a huge flush of oil with a lot of natural gas to boot. The oil was needed far more than the gas. Then someone figured out that any tight reservoir, shale, sand or lime, would respond to large fracks and long horizontal laterals. The race was on.
But rapidly the pipelines bulged with unwanted gas. Gas prices fell like a rock and have never recovered since 2014 to anything near an economic price. Drillers begged regulators to let them flare the gas, simply burn it off to get to the oil. That left the Fayetteville and Barnett in the dust. The chart below shows the very rise and fall of the Fayetteville shale. The basin is dying and production is tiny percentage of its peak. No new wells have been drilled for several years. No leases have been taken. And no one is buying mineral rights. The intrinsic value of the gas will have to wait until the price is sufficient to justify additional drilling. And that may be decades.
Meanwhile, these “oil wells” produced oil for a while then rapidly became gas only wells. Once reservoir pressure is depleted, the oil cannot find the borehole and only the smallest molecules of natural gas or “liquids” (mostly ethane or propane) can reach the borehole and be produced. So the glut of natural gas remains and at $1 to perhaps $1.50/MCF is below the price necessary to cash flow a well profitably. The glut got so bad in West Texas that the natural gas price fell to a single penny. Then this spring (2020) oil futures crashed into negative territory finally bringing a halt to the idea that the Permian Basin was some sort of money machine. Dozens of oil operators and hundreds of service companies have closed their doors or filed bankruptcy, including Chesapeake Energy, one of the earliest pioneers in the shale boom. It’s no surprise to old timers like me who has seen boom and bust all before.

My appreciation to John Sharp (Orion Consulting, Inc.) of Fort Smith, Arkansas for the graph used below.

Production curves of Select Counties in the Fayetteville Shale

Flawed Premise in Global Warming Argument

The NM Bureau of Geology and Mineral Resources publishes a quarterly. The current issue claims the average rainfall in New Mexico has remained erratic but neither up nor down over the past 50 years. But they ominously claim the temperature has risen by 3 degrees and is likely to increase dramatically.

It took about 10 seconds looking at their chart to realize they carefully dramatized a cooling period during the 50s and 1960s and highlight the higher temperatures of the past 30…which are suspect in the first place.  NOAA clearly has altered temperature data and “adjusted” temperature. In fact, their temperature charts changed from 1998 to 2018 rather dramatically. It suppressed the hot years of the depression and increased the temperatures.

But in New Mexico, the temperature charts are different according to who is doing what. And the unaltered data does not support the assumption that the state is heating up beyond normal temperature trends which vary from extreme drought to relatively benign temperatures.  In other words, if we go back 120 years we see that the trends are similar to years gone by. Just saying…